In this tutorial, How to install Prometheus on RHEL / CentOS 7. Prometheus is an open-source
Install Prometheus
Create user and group Prometheus system
sudo groupadd --system prometheus
sudo useradd -s /sbin/nologin --system -g prometheus prometheus
Create the data directory for Prometheus
sudo mkdir /var/lib/prometheusPrometheus creates the configuration directory
sudo mkdir -p -m 775 /etc/prometheus/{rules,rules.d,files_sd}Download and extract Prometheus
cd /tmp
export RELEASE=2.8.1
wget https://github.com/prometheus/prometheus/releases/download/v${RELEASE}/prometheus-${RELEASE}.linux-amd64.tar.gz
tar xvf prometheus-${RELEASE}.linux-amd64.tar.gz
cd prometheus-${RELEASE}.linux-amd64/
Copy Prometheus binary, consoles and console_libraries
sudo cp prometheus promtool /usr/local/bin/
sudo cp -r consoles/ console_libraries/ /etc/prometheus/
Create a Prometheus configuration file.
sudo vi /etc/prometheus/prometheus.ymlThe content as below
# Global config
global:
  scrape_interval:     15s # Set the scrape interval to every 15 seconds. Default is every 1 minute.
  evaluation_interval: 15s # Evaluate rules every 15 seconds. The default is every 1 minute.
  scrape_timeout: 15s  # scrape_timeout is set to the global default (10s).

# A scrape configuration containing exactly one endpoint to scrape:# Here it's Prometheus itself.
scrape_configs:
  # The job name is added as a label `job=<job_name>` to any timeseries scraped from this config.
  - job_name: 'prometheus'

    # metrics_path defaults to '/metrics'
    # scheme defaults to 'http'.

    static_configs:
    - targets: ['localhost:9090']
Create a Prometheus systemd service unit file.
sudo vi /etc/systemd/system/prometheus.serviceThe content Prometheus systemd service as below
[Unit]
Description=Prometheus
Documentation=https://prometheus.io/docs/introduction/overview/
Wants=network-online.target
After=network-online.target

[Service]
Type=simple
Environment="GOMAXPROCS=2"
User=prometheus
Group=prometheus
ExecReload=/bin/kill -HUP $MAINPID
ExecStart=/usr/local/bin/prometheus \
  --config.file=/etc/prometheus/prometheus.yml \
  --storage.tsdb.path=/var/lib/prometheus \
  --web.console.templates=/etc/prometheus/consoles \
  --web.console.libraries=/etc/prometheus/console_libraries \
  --web.listen-address=0.0.0.0:9090 \
  --web.external-url=

SyslogIdentifier=prometheus
Restart=always

[Install]
WantedBy=multi-user.target
Note: You remember to edit the line: Environment=”GOMAXPROCS=2 with replacing 2 is the number of vcpus on the server.
Clean install
rm -rf prometheus-${RELEASE}.linux-amd64.tar.gz
rm -rf prometheus-${RELEASE}.linux-amd64/
Change directory permission.
sudo chown -R prometheus:prometheus /etc/prometheus
sudo chown -R prometheus:prometheus /var/lib/prometheus/
Reload systemd daemon and start the Prometheus service
sudo systemctl daemon-reload
sudo systemctl start prometheus
Configure firewalld
sudo firewall-cmd --permanent --add-rich-rule 'rule family="ipv4" \
source address="192.168.10.0/24" port protocol="tcp" port="9090" accept'
sudo firewall-cmd --reload
Test access Prometheus service on port 9090
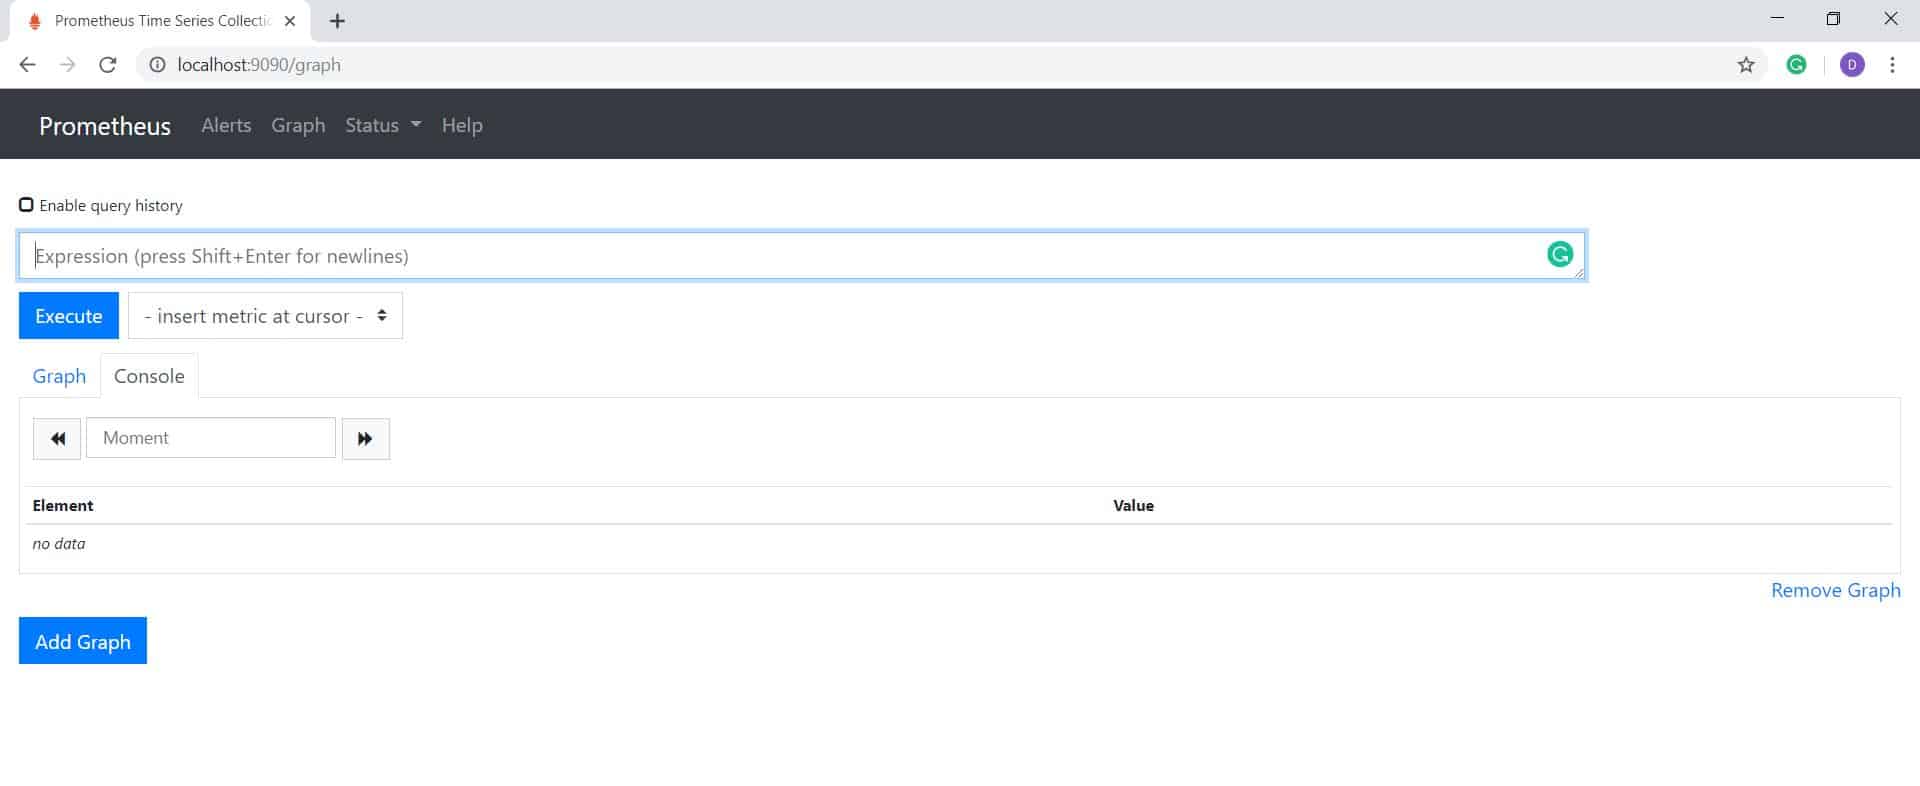
$ telnet localhost 9090Access Prometheus Web dashboard on server

You have to install Prometheus on your system! You got it. Thank you for reading the DevopsRoles page!
