Today, I have installed Jenkins on Linux AWS can not start. Then start it, but an error as below. I…
DevOps Blog – Latest DevOps Articles and Tutorials
Jenkins auto build when git commit
Table of Contents1 Introduction2 Step-by-Step Guide to Jenkins Auto Build on Commit2.1 Configuration Setup2.2 How to Install the Git and…
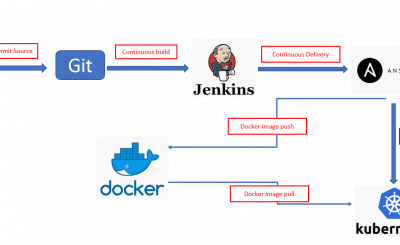
DevOps CI/CD pipeline tutorial part 4
In this tutorial, I will integrate Ansible into the Jenkins CI/CD pipeline. Now, let’s go to DevOps CI/CD pipeline tutorial…
DevOps CI/CD pipeline tutorial part 3
I will continue the article DevOps CI/CD pipeline tutorial part 3. In this tutorial, How to integrating Docker in CI/CD…
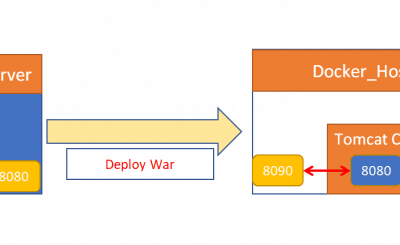
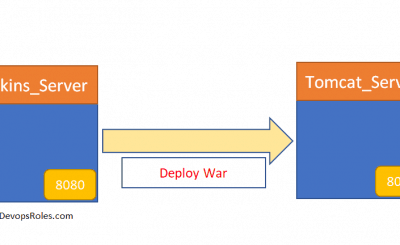
DevOps CI/CD pipeline tutorial part 2
I wrote DevOps CI/CD pipeline tutorial part 2. Serial the previous article here. This time I will integrate Tomcat Server…
DevOps CI/CD pipeline tutorial part 1
In this tutorial, How to create DevOps CI/CD pipelines using Git, Jenkins, Ansible, Docker, and Kubernetes on AWS. How to…
Vagrant issues solved
Vagrant up command the response in error “No usable default provider could be found for your system”. Vagrant issues solved.…
Things to do in the initial configuration of CentOS 7
What do you need to do in the initial configuration of CentOS 7? In this tutorial, Step by step I…
Oracle notes for beginners: Your Essential Guide to Getting Started
Table of Contents1 Introduction2 Oracle notes for beginners2.1 Oracle Database commands2.2 Kill session in Oracle3 Conclusion Introduction In this tutorial,…
How to install Terraform on Linux
In this tutorial, How to install Terraform on Centos and Ubuntu. Terraform an Open Source tool. It is safely and…
