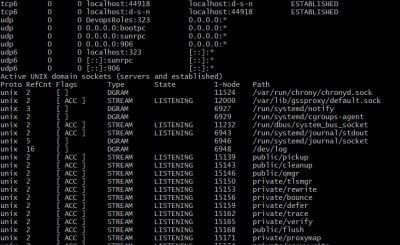
Introduction Welcome to this tutorial where I’ll guide you through the basics to advanced uses of the netstat command in…
Linux
Monitoring with Grafana InfluxDB and Telegraf
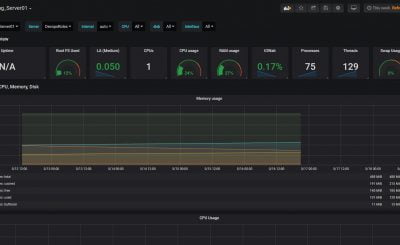
Introduction In this tutorial, How to monitor your system using Grafana InfluxDB and Telegraf. This article will guide you through…
Influxdb getting started
Introduction In this tutorial, we get started with InfluxDB. we can use commands with InfluxDB. In the latter-mentioned post, I…
How to install Telegraf on Linux
Introduction Telegraf is a versatile and efficient agent for collecting and reporting metrics. It supports a wide array of data…
Grafana reset admin password
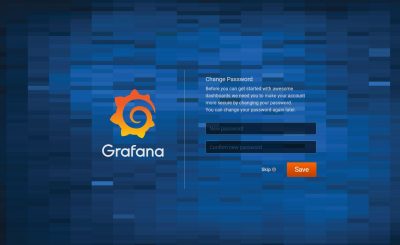
Introduction I have forgotten the password admin Grafana dashboard. Yesterday, I can not log in to my Grafana dashboard. I…
Step by step Install JDK on CentOS
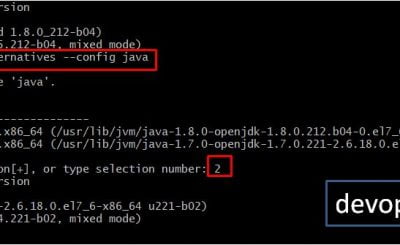
In this tutorial, How to Install JDK on CentOS step by step. How to switch between JDK 7 and JDK…
Install Grafana on Centos 7
Grafana is tool monitoring and Data visualization with support InfluxDB, Graphite, Prometheus, Elasticsearch, and many more databases. In this tutorial,…
Install nslookup on Linux
Introduction In this tutorial, How to install nslookup on Linux. nslookup is part of the bind-utils package. The package bind-utils…
Install Prometheus on RHEL / CentOS 7
In this tutorial, How to install Prometheus on RHEL / CentOS 7. Prometheus is an open-source monitoring system and time…
Install InfluxDB on RHEL / Centos 7
In this tutorial, How to install InfluxDB on RHEL / Centos 7. InfluxDB is an open-source time-series database. It is…
