Table of Contents
Introduction
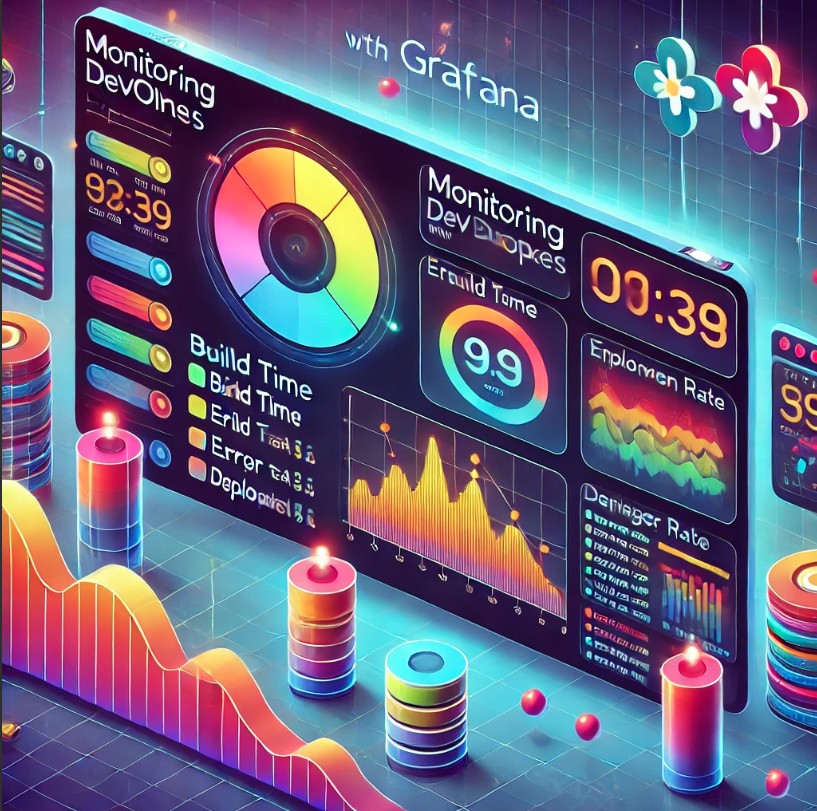
In today’s fast-paced development environments, monitoring DevOps pipelines has become a critical component of maintaining operational efficiency and ensuring the successful deployment of applications. Grafana, a leading open-source analytics and monitoring solution, provides developers and operations teams with powerful tools to visualize and monitor their DevOps workflows. By integrating Grafana with your pipeline, you can track key metrics, identify bottlenecks, and enhance overall performance.
This guide will take you through the essentials of monitoring DevOps pipelines with Grafana, from setup to advanced use cases, ensuring you maximize its capabilities.
Why Monitor DevOps Pipelines?
Benefits of Monitoring
- Improved Workflow Visibility: Gain real-time insights into every stage of the pipeline.
- Early Issue Detection: Identify and resolve errors before they escalate.
- Optimized Resource Usage: Track and manage resources efficiently.
- Enhanced Team Collaboration: Enable data-driven decision-making across teams.
Setting Up Grafana for DevOps Pipelines
Prerequisites
Before diving into monitoring, ensure the following:
- A running instance of Grafana.
- Access to pipeline data sources (e.g., Prometheus, Elasticsearch, or InfluxDB).
- Administrator privileges for configuration.
Installation and Configuration
- Install Grafana:
- Use the official Grafana documentation for step-by-step installation on your preferred platform (Grafana Installation Guide).
- Connect Data Sources:
- Navigate to
Configuration > Data Sourcesin Grafana. - Add a new data source and configure it based on your pipeline tool (e.g., Jenkins, GitLab CI/CD).
- Navigate to
- Create a Dashboard:
- Go to
Create > Dashboardand start adding panels. - Select metrics relevant to your pipeline stages, such as build time, deployment frequency, and error rates.
- Go to
Key Metrics to Monitor
Build and Deployment Metrics
- Build Time: Measure the duration of builds to identify performance issues.
- Deployment Frequency: Track how often changes are deployed to production.
Pipeline Health Metrics
- Error Rate: Monitor the frequency of failed builds or stages.
- Pipeline Duration: Evaluate the time taken from code commit to deployment.
Resource Utilization Metrics
- CPU and Memory Usage: Ensure your CI/CD servers are not overloaded.
- Disk Usage: Monitor storage used by artifacts and logs.
Building Dashboards in Grafana
Step-by-Step Example
- Create a New Panel:
- Click on
Add new panelin your dashboard. - Choose a data source (e.g., Prometheus).
- Click on
- Select a Query:
- Example for monitoring build times:
sum(rate(jenkins_build_duration_seconds[5m]))
- Customize Visualizations:
- Use line charts for trends or bar graphs for comparisons.
- Add thresholds to highlight critical values.
- Add Alerts:
- Navigate to the
Alerttab in your panel editor. - Define conditions such as:
- Trigger an alert if build time exceeds 10 minutes.
- Navigate to the
- Save and Share:
- Save your dashboard and share it with your team for collaborative monitoring.
Advanced Monitoring Use Cases
Monitoring Across Multiple Pipelines
- Use tags to filter metrics from different projects.
- Create a unified dashboard to compare performance across pipelines.
Correlating Pipeline Metrics with Application Performance
- Integrate Grafana with APM tools like New Relic or Dynatrace.
- Correlate deployment events with spikes in application latency.
Automating Alerts and Notifications
- Configure alerts to notify your team via Slack or email.
- Use Grafana’s API to automate incident management workflows.
Frequently Asked Questions (FAQ)
1. What are the benefits of using Grafana over other tools?
Grafana’s flexibility, open-source nature, and extensive plugin ecosystem make it a preferred choice for monitoring diverse systems and pipelines.
2. Can Grafana integrate with my existing CI/CD tools?
Yes, Grafana supports integrations with Jenkins, GitLab, CircleCI, and other popular CI/CD platforms through data sources and plugins.
3. How do I troubleshoot pipeline monitoring issues in Grafana?
Ensure data sources are correctly configured and accessible. Use the Query Inspector to debug data fetching issues.
4. Is Grafana free to use?
Grafana offers both a free open-source version and a paid enterprise edition with additional features.

External Resources
Conclusion
Monitoring DevOps pipelines with Grafana empowers teams to achieve greater efficiency, reliability, and transparency in their workflows. From tracking build times to analyzing resource utilization, Grafana offers unparalleled capabilities for visualizing and optimizing DevOps processes. Start integrating Grafana into your DevOps pipeline today and take the first step toward a more resilient and informed development cycle.Thank you for reading the DevopsRoles page!


