Table of Contents
Introduction
Welcome to this tutorial where I’ll guide you through the basics to advanced uses of the netstat command in Linux, with practical examples to help you master this tool.
What is Netstat?
Netstat is a command-line utility used to display all active network connections, both incoming and outgoing, on Unix, Linux, and Windows NT-based systems. It’s invaluable for network administration and monitoring.
Details can be found on the netstat command manual page:
[root@DevopsRoles ~]# man netstat | moreDetailed Usage of the Netstat Command in Linux
Here’s how you can use the netstat command in Linux to explore various network statistics:
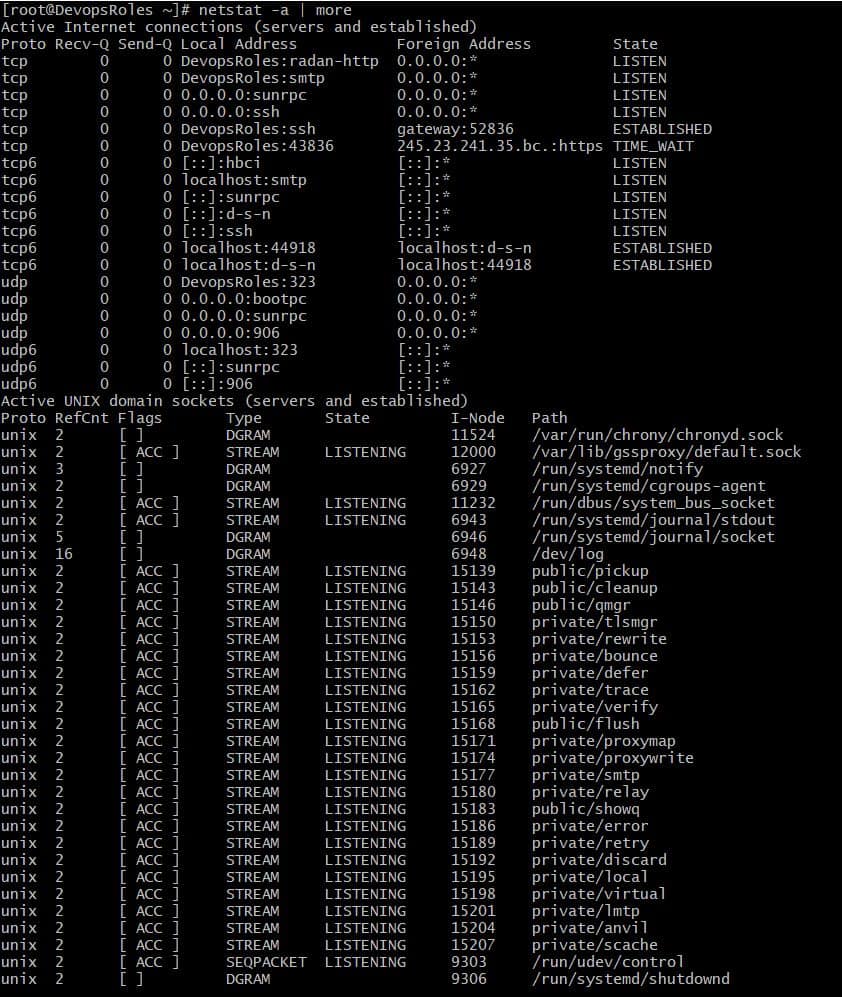
1. List all LISTENING Ports of TCP and UDP connections using netstat -a option

2. Viewing Open TCP Socket Connections
This displays all active TCP connections. Execute this command to see detailed socket information.
[root@DevopsRoles ~]# netstat -nplt
Active Internet connections (only servers)
Proto Recv-Q Send-Q Local Address           Foreign Address         State       PID/Program name
tcp        0      0 127.0.0.1:8088          0.0.0.0:*               LISTEN      659/influxd
tcp        0      0 127.0.0.1:25            0.0.0.0:*               LISTEN      792/master
tcp        0      0 0.0.0.0:111             0.0.0.0:*               LISTEN      319/rpcbind
tcp        0      0 0.0.0.0:22              0.0.0.0:*               LISTEN      655/sshd
tcp6       0      0 :::3000                 :::*                    LISTEN      662/grafana-server
tcp6       0      0 ::1:25                  :::*                    LISTEN      792/master
tcp6       0      0 :::111                  :::*                    LISTEN      319/rpcbind
tcp6       0      0 :::8086                 :::*                    LISTEN      659/influxd
tcp6       0      0 :::22                   :::*                    LISTEN      655/sshd
3. Viewing Open UDP Socket Connections
Similar to TCP, this command shows all UDP connections currently open and active.
[root@DevopsRoles ~]# netstat -nplu
Active Internet connections (only servers)
Proto Recv-Q Send-Q Local Address           Foreign Address         State       PID/Program name
udp        0      0 127.0.0.1:323           0.0.0.0:*                           313/chronyd
udp        0      0 0.0.0.0:68              0.0.0.0:*                           464/dhclient
udp        0      0 0.0.0.0:111             0.0.0.0:*                           319/rpcbind
udp        0      0 0.0.0.0:906             0.0.0.0:*                           319/rpcbind
udp6       0      0 ::1:323                 :::*                                313/chronyd
udp6       0      0 :::111                  :::*                                319/rpcbind
udp6       0      0 :::906                  :::*                                319/rpcbind
4. List all TCP Listening Ports
[root@DevopsRoles ~]# netstat -lt
Active Internet connections (only servers)
Proto Recv-Q Send-Q Local Address           Foreign Address         State
tcp        0      0 DevopsRoles:radan-http  0.0.0.0:*               LISTEN
tcp        0      0 DevopsRoles:smtp        0.0.0.0:*               LISTEN
tcp        0      0 0.0.0.0:sunrpc          0.0.0.0:*               LISTEN
tcp        0      0 0.0.0.0:ssh             0.0.0.0:*               LISTEN
tcp6       0      0 [::]:hbci               [::]:*                  LISTEN
tcp6       0      0 localhost:smtp          [::]:*                  LISTEN
tcp6       0      0 [::]:sunrpc             [::]:*                  LISTEN
tcp6       0      0 [::]:d-s-n              [::]:*                  LISTEN
tcp6       0      0 [::]:ssh                [::]:*                  LISTEN
4. List all UDP Listening Ports
[root@DevopsRoles ~]# netstat -lu
Active Internet connections (only servers)
Proto Recv-Q Send-Q Local Address           Foreign Address         State
udp        0      0 DevopsRoles:323         0.0.0.0:*
udp        0      0 0.0.0.0:bootpc          0.0.0.0:*
udp        0      0 0.0.0.0:sunrpc          0.0.0.0:*
udp        0      0 0.0.0.0:906             0.0.0.0:*
udp6       0      0 localhost:323           [::]:*
udp6       0      0 [::]:sunrpc             [::]:*
udp6       0      0 [::]:906                [::]:*
5. Show Statistics by Protocol
[root@DevopsRoles ~]# netstat -s
Ip:
    9607 total packets received
    0 forwarded
    0 incoming packets discarded
    9605 incoming packets delivered
    4614 requests sent out
    7 outgoing packets dropped
Icmp:
    16 ICMP messages received
    0 input ICMP message failed.
    ICMP input histogram:
        destination unreachable: 16
    16 ICMP messages sent
    0 ICMP messages failed
    ICMP output histogram:
        destination unreachable: 16
IcmpMsg:
        InType3: 16
        OutType3: 16
Tcp:
    267 active connections openings
    412 passive connection openings
    2 failed connection attempts
    3 connection resets received
    3 connections established
    20699 segments received
    19546 segments send out
    66 segments retransmited
    0 bad segments received.
    13 resets sent
Udp:
    184 packets received
    16 packets to unknown port received.
    0 packet receive errors
    200 packets sent
    0 receive buffer errors
    0 send buffer errors
UdpLite:
TcpExt:
    255 TCP sockets finished time wait in fast timer
    245 delayed acks sent
    16 delayed acks further delayed because of locked socket
    Quick ack mode was activated 66 times
    6400 packet headers predicted
    2503 acknowledgments not containing data payload received
    8067 predicted acknowledgments
    TCPLossProbes: 66
    TCPLossProbeRecovery: 65
    66 DSACKs sent for old packets
    66 DSACKs received
    TCPDSACKIgnoredNoUndo: 65
    TCPRcvCoalesce: 3322
    TCPOrigDataSent: 14558
    TCPHystartTrainDetect: 7
    TCPHystartTrainCwnd: 124
IpExt:
    InNoRoutes: 2
    InOctets: 1806054
    OutOctets: 7957156
    InNoECTPkts: 9899
6. Displaying Service name with PID
[root@DevopsRoles ~]# netstat -tp
Active Internet connections (w/o servers)
Proto Recv-Q Send-Q Local Address           Foreign Address         State       PID/Program name
tcp        0      0 DevopsRoles:ssh         gateway:52836           ESTABLISHED 2434/sshd: vagrant
tcp6       0      0 localhost:44918         localhost:d-s-n         ESTABLISHED 654/telegraf
tcp6       0      0 localhost:d-s-n         localhost:44918         ESTABLISHED 659/influxd
7. Displaying Promiscuous Mode
[root@DevopsRoles ~]# netstat -ac 6 | grep tcp
tcp        0      0 DevopsRoles:radan-http  0.0.0.0:*               LISTEN
tcp        0      0 DevopsRoles:smtp        0.0.0.0:*               LISTEN
tcp        0      0 0.0.0.0:sunrpc          0.0.0.0:*               LISTEN
tcp        0      0 0.0.0.0:ssh             0.0.0.0:*               LISTEN
tcp        0      0 DevopsRoles:ssh         gateway:52836           ESTABLISHED
tcp6       0      0 [::]:hbci               [::]:*                  LISTEN
tcp6       0      0 localhost:smtp          [::]:*                  LISTEN
tcp6       0      0 [::]:sunrpc             [::]:*                  LISTEN
tcp6       0      0 [::]:d-s-n              [::]:*                  LISTEN
tcp6       0      0 [::]:ssh                [::]:*                  LISTEN
tcp6       0      0 localhost:44918         localhost:d-s-n         ESTABLISHED
tcp6       0      0 localhost:d-s-n         localhost:44918         ESTABLISHED
8. Show Network Interface Transactions
[root@DevopsRoles ~]# netstat -i
Kernel Interface table
Iface             MTU    RX-OK RX-ERR RX-DRP RX-OVR    TX-OK TX-ERR TX-DRP TX-OVR Flg
eth0             1500    10190      0      0 0          8724      0      0      0 BMRU
lo              65536    12237      0      0 0         12237      0      0      0 LRU
9. Find Listening Programs
[root@DevopsRoles ~]# netstat -ap | grep grafana
tcp6       0      0 [::]:hbci               [::]:*                  LISTEN      662/grafana-server
unix  3      [ ]         STREAM     CONNECTED     14247    662/grafana-server
Conclusion
By following the netstat examples provided, you can effectively leverage the netstat command in Linux to gain insights into your system’s network connections. This guide aims to be a practical resource for both new and seasoned users. Thank you for choosing DevopsRoles for your learning needs!
